E-Waste can take the shape of any electronic device that has reached the end of its life. These electronic devices are an amalgamation of more than 60% of elements from the periodic table. Up to 69 elements from the periodic table are found in an electronic device. Elements that are found include gold, silver, copper, platinum, palladium, indium, germanium, bismuth, and antimony. Out of all these elements, gold is the one that marks the highest concentration. E-waste usually contains 280g of gold per tonne of e-waste, highlighting the necessity to transform 280g of waste into growth.
There are serious concerns among the global electronics industry value chain regarding the availability and supply of new materials for electrical and electronic devices in the future age. With E-Waste containing so many metals and minerals, there remains a certain opportunity for value recovery.
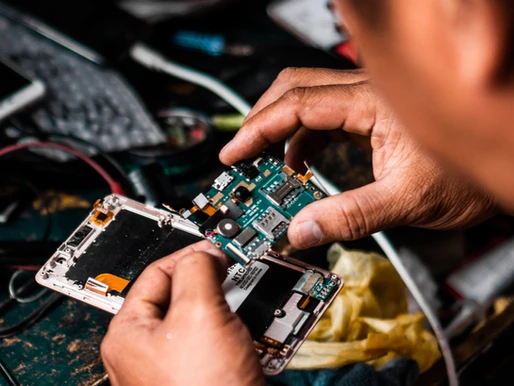
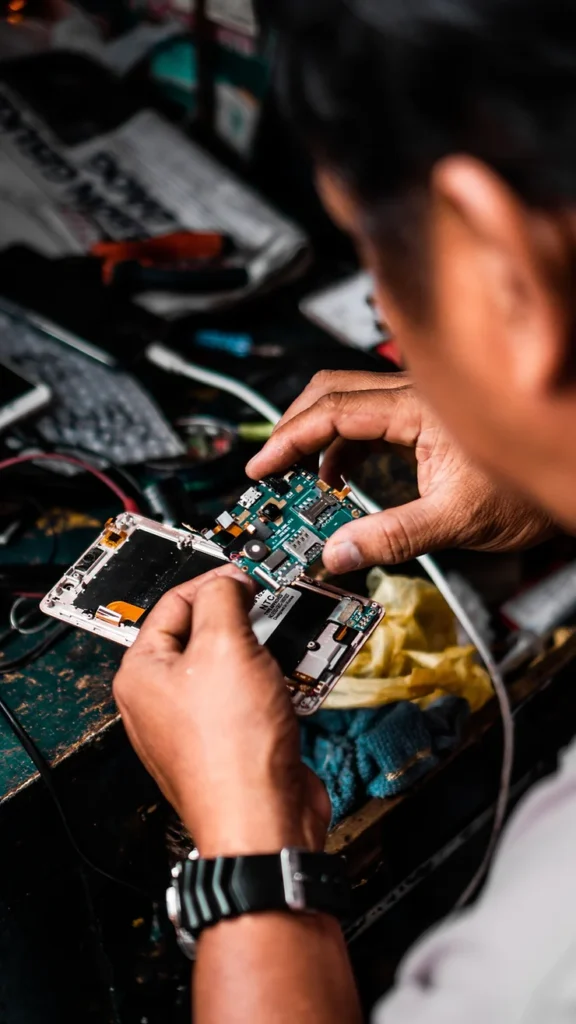
The correlation fallacy. Electronics, Technology and Waste
Quite similar to fast food and fashion, electronics are picking up the trend similar as income capability is in rising across the globe. Electronics has a rapid turnover as companies selling electronics are dependent on the “latest version”. This leads to mass waste of electronics which finds its place in landfills. However, another correlation electronics have with technology is its positive correlation. With mobile payments rampant, electronics especially smartphones are witnessing tertiary recycling as well. While this remains an encouraging trend, the worrisome fact remains that the gap between production and recycling is having its impact on the landfill.
Recycling rates are quite low. In the EU, which remains the epi-center green initiatives are struggling with E-Waste Recycling. Only 35% of E-Waste is recycled according to official figures. The global average is 20%.
The Global Legislation on E-Waste
67 countries across the globe have encouraging legislation in place to deal with the e-waste they generate. These legislations are a part of the Extended Producer Responsibility. The legislation covers about 65% of the global population. E-Waste exporting comes under the Basel Convention on the Control of Transboundary Movements of Hazardous Wastes and Their Disposal which has been accepted by 188 countries. Even with the mentioned conventions in place, a large part of the E-Waste trade is illegal and undocumented.
Monitoring of the quantities and flow of e-waste remains of paramount importance. The development of sound policies and legal instruments can be attained with better data collection and analysis. Understanding the quantity of e-waste will enable policymakers to create ad-hoc instruments either financial or infrastructure wise to ensure there is an ecosystem being built that has a market capability.
How much E-Waste are we generating?
According to Global E-Waste monitor 2017, 44.7 million metric tonnes of E-Waste was generated. Out of which one-half constitutes personal devices such as smartphones, computers etc. Subsequently, a report in 2020 highlights that globally, 53.6 million tonnes was generated in 2019, which translates to 7.3kg of e-waste generated per capita. When we dig deeper into the constituents of e-waste, we find that in a middle to a low-income country such as India – with average household size being 5.3 with an average purchasing power parity in USD per capita of 3.503- on average 10% of the households own a refrigerator, 10 % of the households own a laptop/desktop, 60% of the households own light bulbs, 1% of households own washing machines and microwaves. Therefore, in a developing country like India, these appliances contribute to e-waste according to its percentage of ownership.
Furthermore, a report in 2017 predicted that around 52 million tonnes of e-waste would be generated in the year by 2021. This prediction was almost accurate with a global production of 57.4 million tonnes of generation of e-waste. The same report predicts that by 2040, carbon emissions generated from e-waste are expected to be 14% of total emissions in 2040. By 2050, the volume of e-waste generated is expected to reach 120 million tonnes per year, and by the year 2060, the world’s consumption of raw materials is expected to double. These numbers compel us to shift towards the market opportunities embedded in this waste.
India’s E-Waste Market opportunity
India is a significant contributor to global waste generation, consequently has a significant market opportunity sitting in its dump yards that is capable of propelling its economy forward. Currently, India is the 3rd largest e-waste generator in the world with an annual e-waste production of 3.23 million metric tonnes. However, over 95% of this waste is handled by the informal sector. As a result of this, India has the highest rate of e-waste collection as the favorite mode of disposal for small businesses is the informal refuse collectors. The problem with the informal sector handling the waste is that they don’t follow the designated protocol and consequently, aren’t able to efficiently extract raw materials from the waste. Almost no rare earth metals are extracted from e-waste through informal recycling, which in turn reduces the supply of raw materials, raises the price of raw materials, and increases the cost of extraction – losing out on the opportunity of creating value out of waste.
Taking the idea of creating value out of waste forward, there is a lot of economic value in e-waste. A tonne of smartphones contains 100 times more gold than an ore of gold. In 2020, it was estimated that more than 54% of the Indian population owns a smartphone. When these smartphones are disposed of, instead of letting them rot in a Dum yard if these e-wastes are efficiently handled, India will be able to save thousands of dollars rotting in a landfill. Moreover, according to a report from 2019, e-waste is worth 62.5 billion dollars per year, therefore, recycling of raw materials could be worth 11.5 billion dollars that just goes to waste due to inefficient extraction of waste.